Do you want to know your digital customers?
Over the years shopping has shifted from brick store to online and the way we manage and optimize our business has to advance as well. Google Analytics is a free tool from Google that will let you install a bit of javascript on your site and it will unfold a lot of insightful information about your visitors.
It monitors each visit of your customer and sends the data back to google where it is handled and put into graphs and visualizations which will help you see clearly who's coming to your site and what they're doing.
We'll discuss how you can query this collection of customer knowledge to find insights and patterns that we can never notice. In fact, we can use the power of Google's machine learning to surface the type of insights that a computer can do far more efficiently than a human ever could by sifting through individual millions of individual interactions.
Is all about measuring your business goals, understanding your performance, and finding ways to optimize and improve that performance. And the most important part here is continuously improving the performance.
The goal here is not to look at fancy charts or reports, but we want to actually do something significant about it. Therefore digital analytics is also a process. Since we cannot manage what we cannot measure, we'll conduct the measurement first. And then we learn from what we see by applying the analysis, and then take action.
We have to go over some key definitions before going into the google analytics tool because in my opinion knowing the language/vocabulary of any new subject makes it easy for you to understand the concepts that will give you a head start on how to manipulate and interprete the data available not just in google analytics but any other analytics tool. So the two concepts we are going to be talking about in this article are metrics and dimensions.
There make up all the data that populates the analytics reports, and we will talk about their differences and their functions in the tool.
Metrics are the quantitative numbers that measures data in counts, ratios, percentages, etc.. while dimensions are quanlitative categories that describe data in breakouts and segments. For example in this particular table
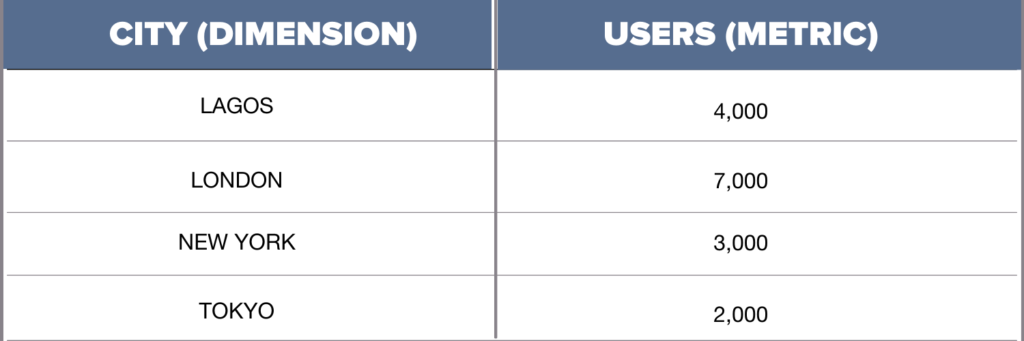
Thinking of digital analytics we're measuring the engagements, and interactions between us that is our website, mobile application or whatever digital experience we're providing to the consumer the person who is visiting. The most basic unit of measurement in google analytics is the event.
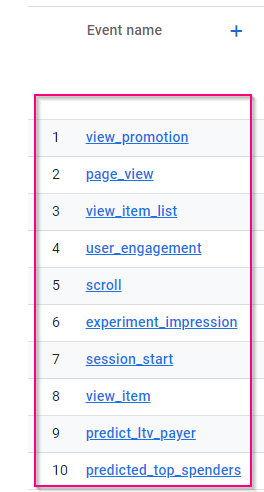
We may think of events in the marketing circle as a product launch, a webinar, conferences etc.. but that is not what we will be talking about here, an event here means an interaction example when somebody clicks a link, load a page, scroll a page, zoom into a product, completing an ecommerce transaction, submitting a form, or when a site has an error. All of these are called type of events and their interactions can be sent back to google as an event.
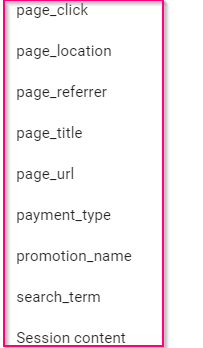
The type of event is decribed as a parameter to that event. we have to point out their structure, each event has a name, as you see here
These are some of the parameters.
I want to stress the idea that almost all of the data sent back to google analytics is going to folloe the event and parameter model. Now we are going to group all of the events in a timeframe and called it a session. A session in google analytics is a collection of interactions that are taking place when a user enters your app or site and when they exit. This used to be referred to as website visits but now that we have to include the apps as well, session is the only accurate term that can be used.
Exit here can be deifined as letting your browser or app go asleep for 30 minutes or if you exit out entirely However, if a user leaves your site but they keep browsing, and then they return back to your site within 30 minutes, they're actually still counted as part of that original session, because it hasn't been 30 minutes and they haven't closed the browser.
In Google Analytics, each event and session is going to be associated back to a user. Google has three ways that they're going to identify a single user, either the cookies on the browser, if they have really nothing else to go on, the next best up is if you've logged into their service. So via Gmail, Android, Google Docs, some way that Google can identify you. Lastly, and probably most specific, is that we can provide a specific ID to Google.
So usually from a login on our own site, if we have one. Now ideally, this allows us to be able to track a single user with those multiple sessions, even if those are on different devices like a phone, a laptop, and a tablet. Now, a group of users who all share a similar dimension or fall under a similar category can make up a segment. Segments can be divided by things like physical location, the type of device that's being used, the traffic source users coming from, basically, any way that we can differentiate those users.
We can create a segment for that. Now, this is a really important concept to understand. So we're going to discuss this later. If you recalled what we mentioned before, that analytics is all about measuring your business objectives. When a user completes an action that you wanted them to take, any action you want to define as a success, we're going to call that a conversion.
We define these conversions through goals in analytics, so that we can identify and record when this conversion takes place. Now it could be completing a purchase, but also just clicking on a particular link, or downloading a document, or completing a very specific form I want to track, or even just spending a certain amount of time on the site. You get to decide what you are calling conversion.
And we're going to use these conversions to measure which of the users have successful visits. Then analyze how they got to the site, what content they saw, and other things that can help us better understand our converting customers. Now, speaking of tracking the source of that traffic, the two most important things we track there are called the source and the medium.
The source is where the user traffic originated from. And the medium is the avenue that the traffic took to get from the source to your site. For example, let's say a user was scrolling through Twitter and clicked on a post that linked to your site. The source of the traffic would be Twitter, that's the who. And the medium they took was the social, that's the how. We want to see which sources and mediums are sending us the best and most converting traffic.
And the overall process of assigning that credit to sources when this conversions happen is called attribution, as we are attributing those conversions to those sources. The customer journey from start to conversion can involve several sources and several sessions, and various content pieces on your site. And proper attribution analysis will tell us which of those touchpoints along the way was having the greatest influence on a successful outcome.
Whether you already have an older universal account or you're starting from scratch, we're going to set up a brand new google analytics 4 account. We will be doing it in both ways either you have an account already or from scratch.
Now in both cases we will head to google analytics site and you are going to sign in if you need to, in fact we would recommend that the account should not be a gmail or work account any other google account would do. Now, if it looks like this is because you're starting from scratch wit a brand new account.
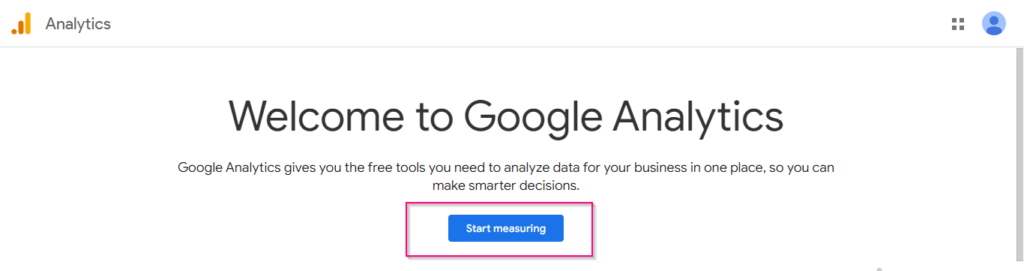
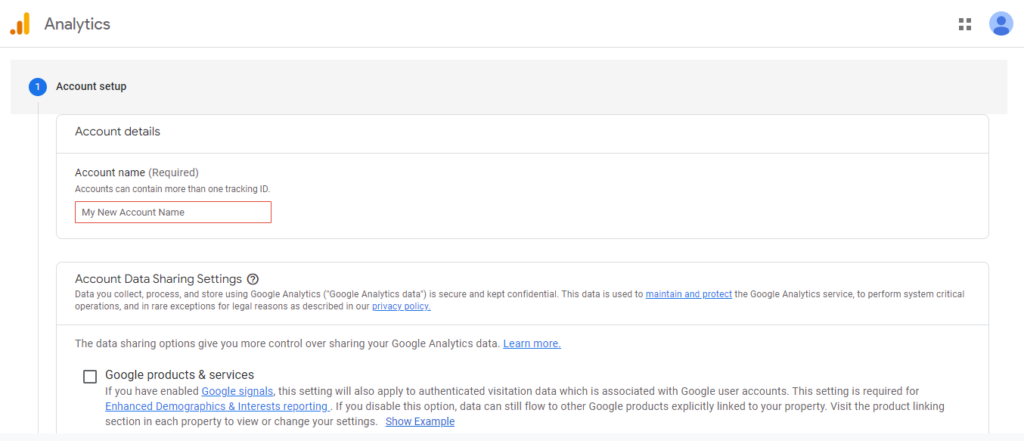
So, we will click on "start measuring" and it's going to send us here to this screen where we are going to start the account setup.
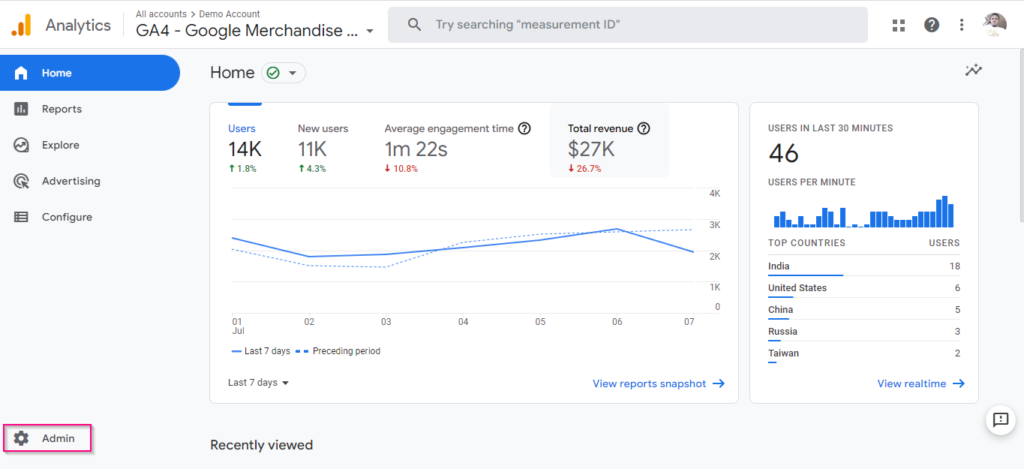
so if you log into the analytics account and you see the page like this it means you already have an account, we will head down to the admin and we're going to create a brand new account here and remember you've already got an account, the older one. We're going to create a google analytics 4 account
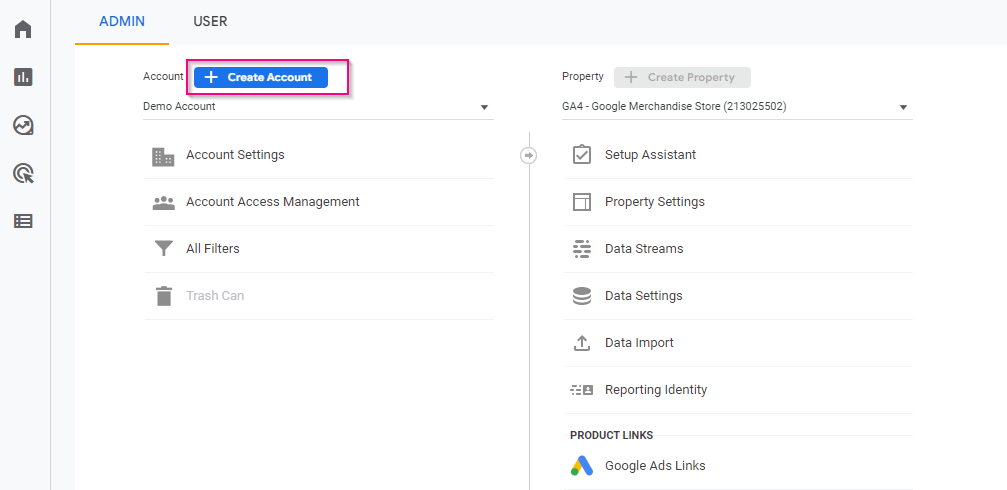
Click on create account and you'll be taken to the section below
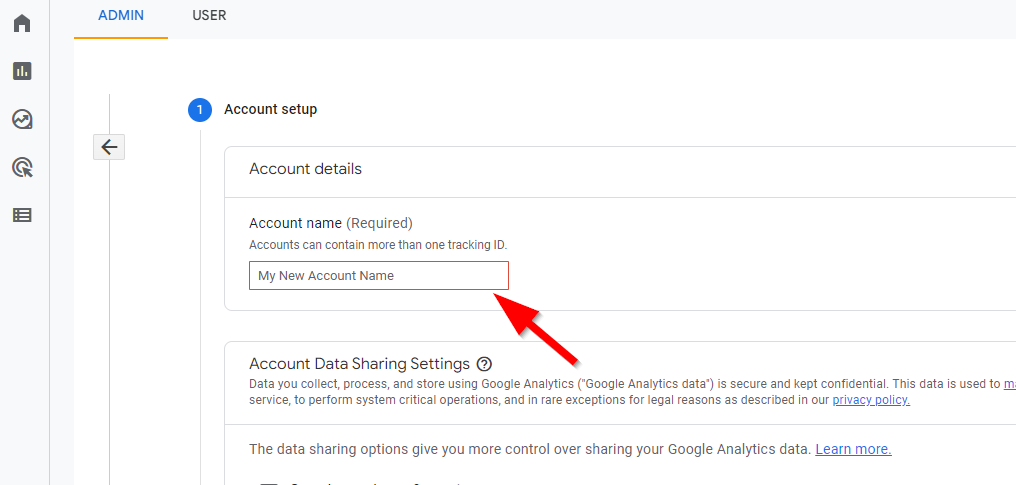
And type in your account name to create a google analytics 4 account.
Below this image we have our account data sharing settings, and you want to have a read through them, figure out which ones you like to choose. for now we're just going to go ahead and just leave those as the default for now.
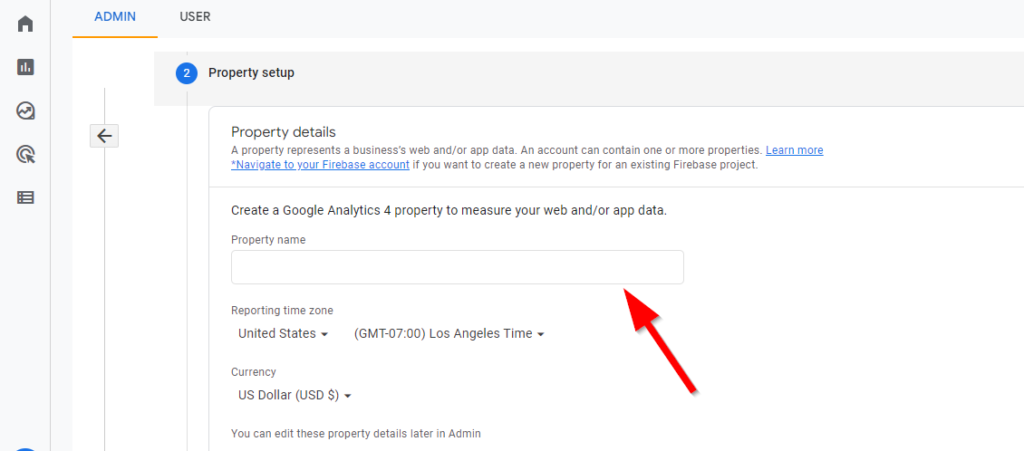
The next thing we have to do is look at our property setup. Now, unlike Universal Analytics, Google Analytics 4 allows you to put both web and app data into the same property here. So this property name should encompass what you plan to put in there. In our case, we're just going to put the web data. So we're just going to call this the website to, you know, keep that clear. what time zone do you want your reporting time to be in? Your currency and then head down to Next.
It's going to ask you a little bit about your business. Don't worry too much about these. We're going to do this together so you know how to configure all of this. So just go ahead and put in whatever describes you the best and click Create. Okay, it's going to ask us about our terms of service. Go ahead and have her read through these and Accept. Now, the next thing we have to do here is set up our data streams collecting.
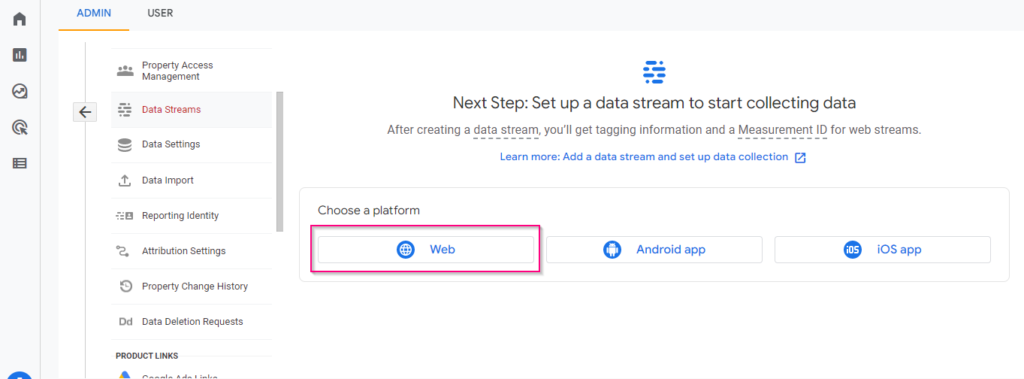
Remember you can send data from an iOS app, an Android app or a website into this property. For the purposes of this article, we're just going to be focused on the web.
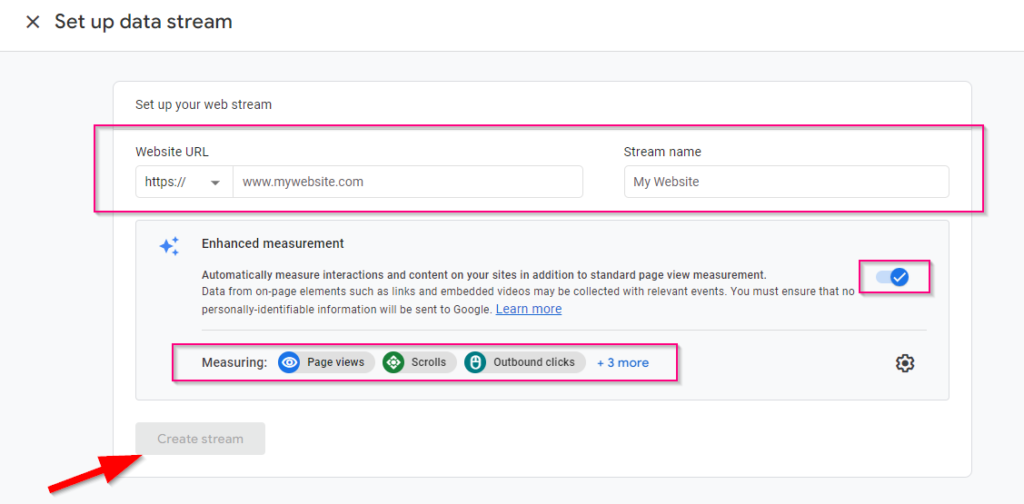
So we're going to go ahead and put that in here, and again it's going to ask us for what website we're sending that in, and then I'm just going to put in here that this is the web stream, and then it's going to ask you about enhanced measurement. This is where we can automatically measure certain types of interactions on the page.
We can measure scrolls, outbound clicks, site search, video engagement, certain types of file downloads, and I do recommend that you leave this on. We're going to have an entire article that dives into this a bit more, but for now we want to go ahead and enable that by default, and we're going to click Create stream to create this stream that's going to populate data.
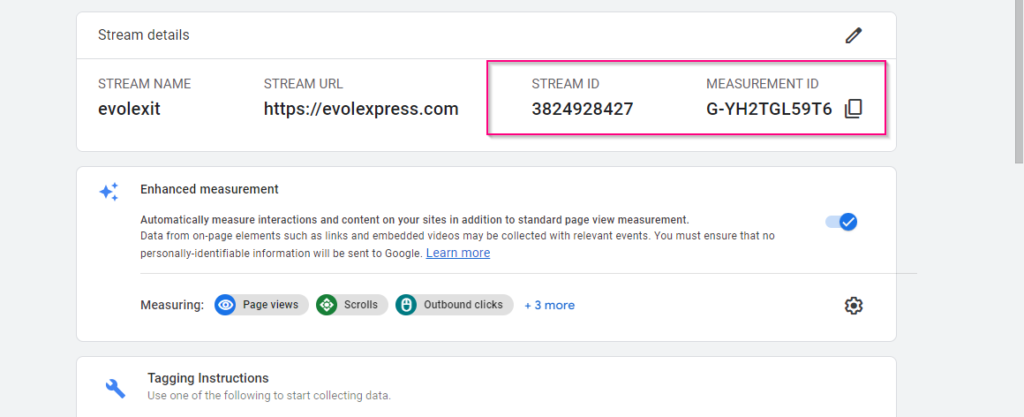
From here, we're going to get this summary page. Important things here, we have our stream name. We have our measurement ID. Up here we have the fact that enhanced measurement was turned on, and down here we're going to have some tagging instructions that are going to show us how we're going to actually go get this onto our site and tag up our pages. So know that you have successfully created a Google Analytics 4 account, and we are ready to start implementing this on your site.


Warning: Undefined array key "preview" in /home/687898.cloudwaysapps.com/qwdynwkwdc/public_html/wp-content/plugins/oxygen/component-framework/components/classes/comments-list.class.php on line 102